About this lesson
What students discover
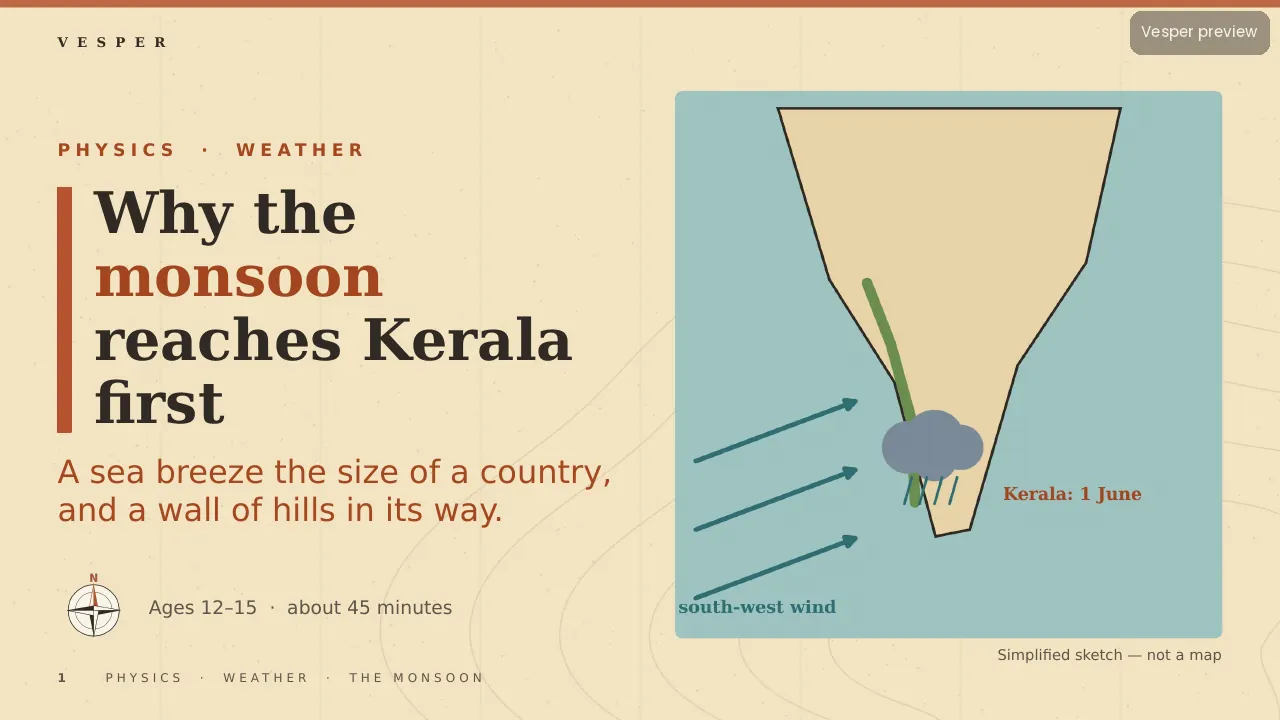
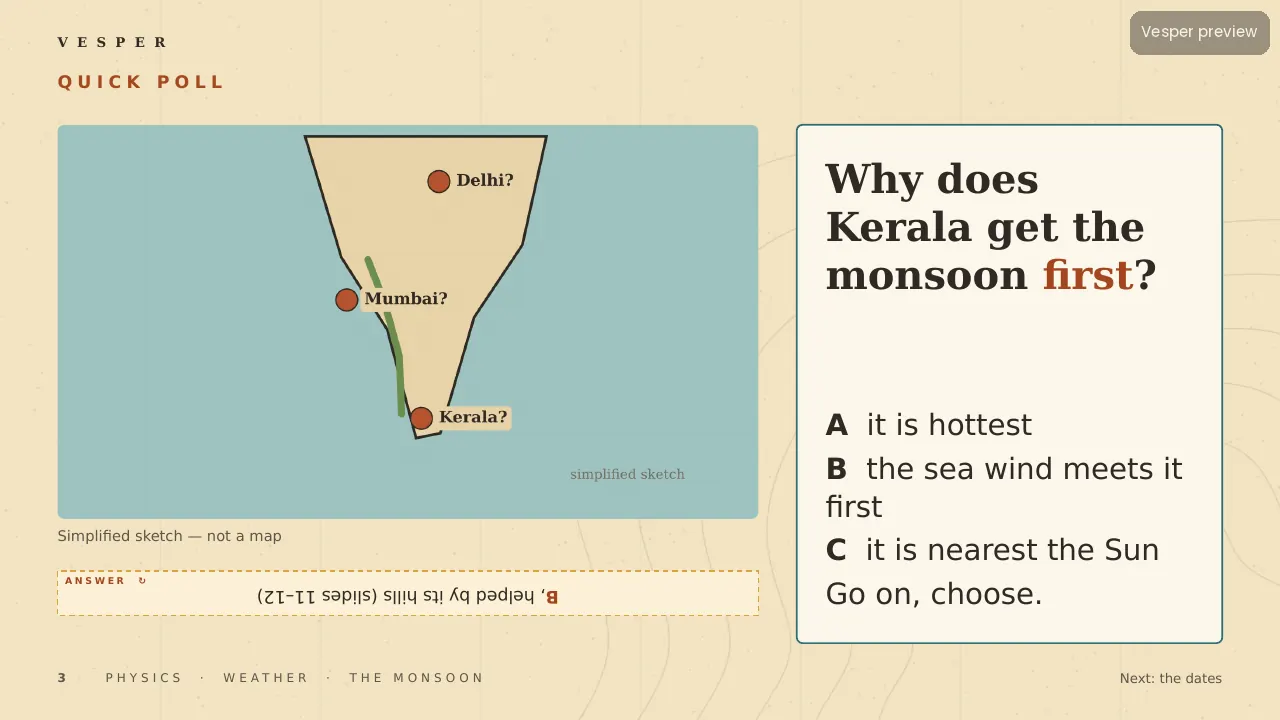
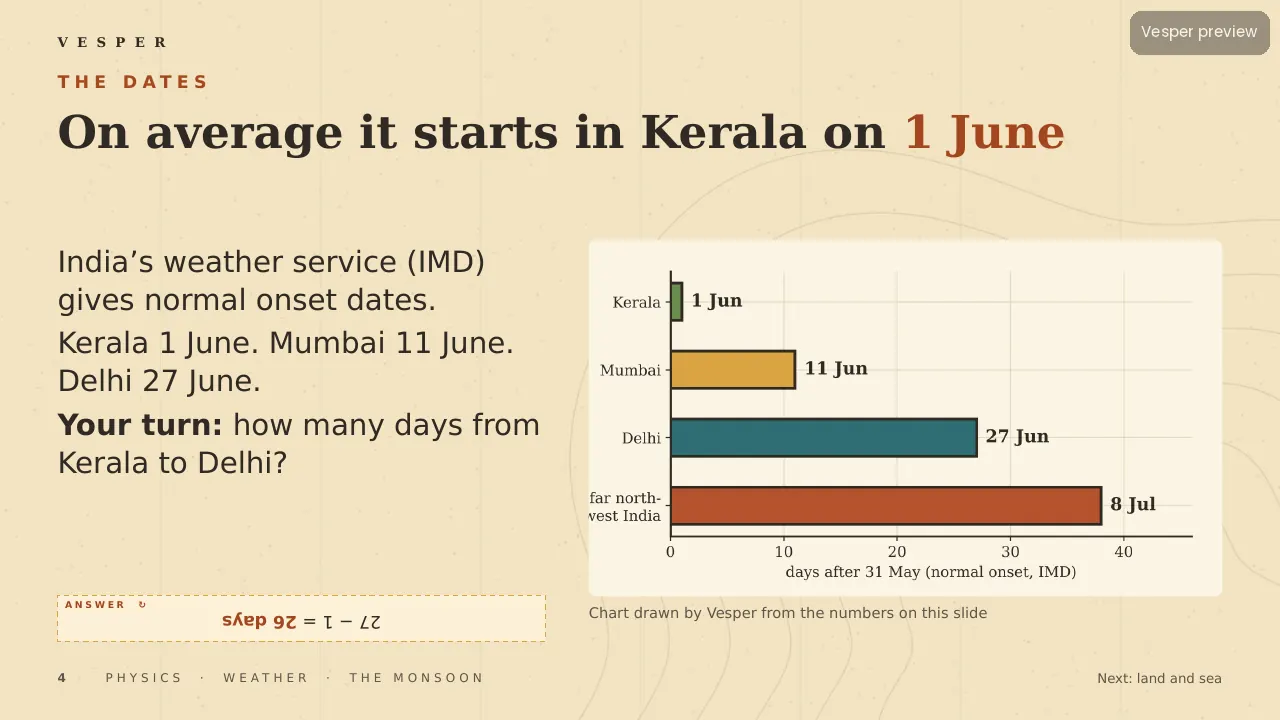
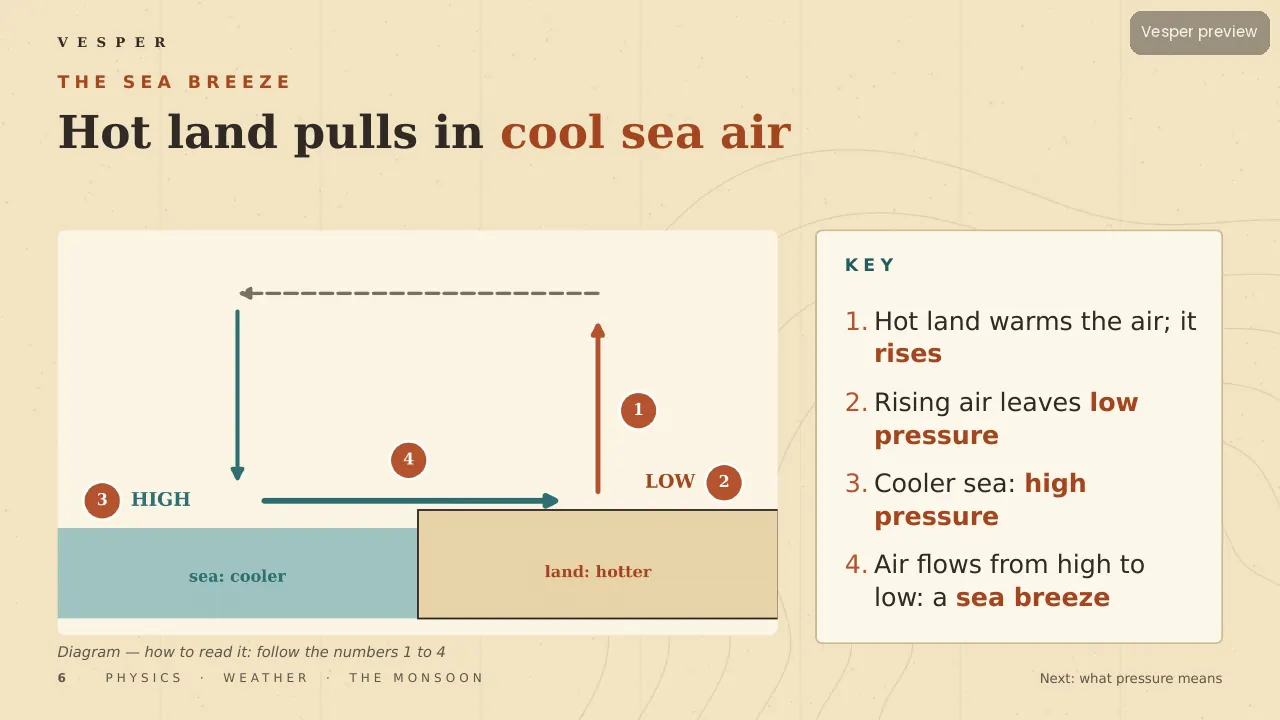
Every year the monsoon reaches the Kerala coast first, around 1 June, then Mumbai (11 June) and Delhi (27 June). Students find out why with real numbers. The same 4,200 J warms water by 1 °C but dry sand by about 5 °C, so land heats faster than sea. A numbered sea-breeze diagram shows hot air rising, low pressure over land and wind flowing from high to low.
Scale that up and India in May (about 45 °C) against the ocean (about 28 °C) becomes a giant sea breeze lasting months. Earth’s spin bends the wind so it arrives from the south-west; Kerala is the first land it meets, and the Western Ghats lift the air, cooling it about 10 °C over 1,500 m until it rains.
Inside the deck
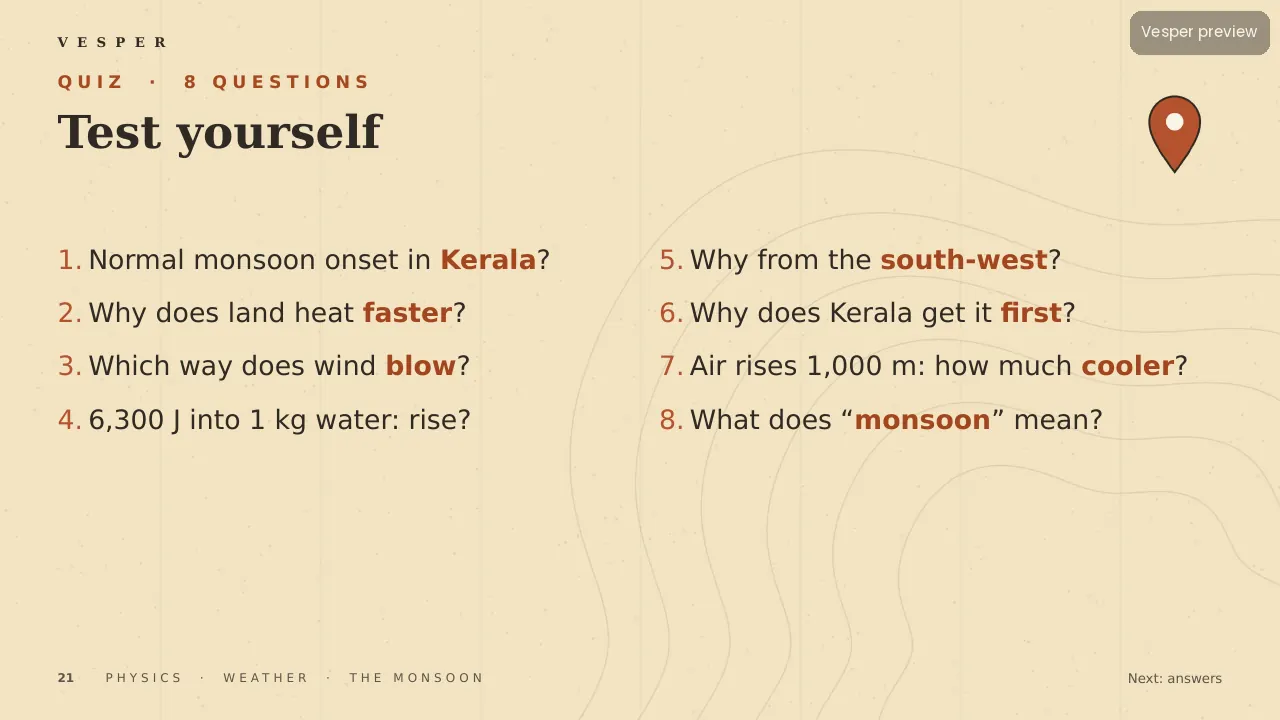
25 slides on the Atlas template with code-drawn maps and diagrams. Students time the monsoon’s march north at about 100 km a day, bust the ‘monsoon means rain’ myth, make a rain gauge, meet Mawsynram’s 11.9 m of rain a year and look at the rise in extreme downpours. Two checkpoints, a poll and an 8-question quiz with explained answers.
How to teach it
Allow about 45 minutes. Ask the hook question on slide 3 and collect guesses before you show the onset dates. The rain-gauge activity on slide 16 can run for a week outside and feed back into a later lesson. The peninsula outline is a simplified sketch, not a map. Notes on every slide give Say, Ask, Watch for and Time.
Who it’s for
For ages 12–15 in geography or physics, covering heat transfer, air pressure, winds and rainfall. It works for students who live with the monsoon and for those who have only read about it.