About this lesson
What students discover
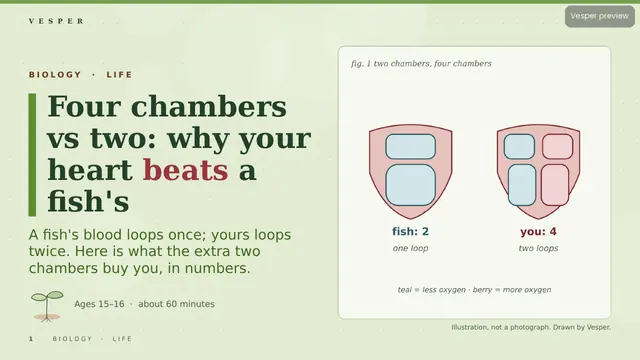
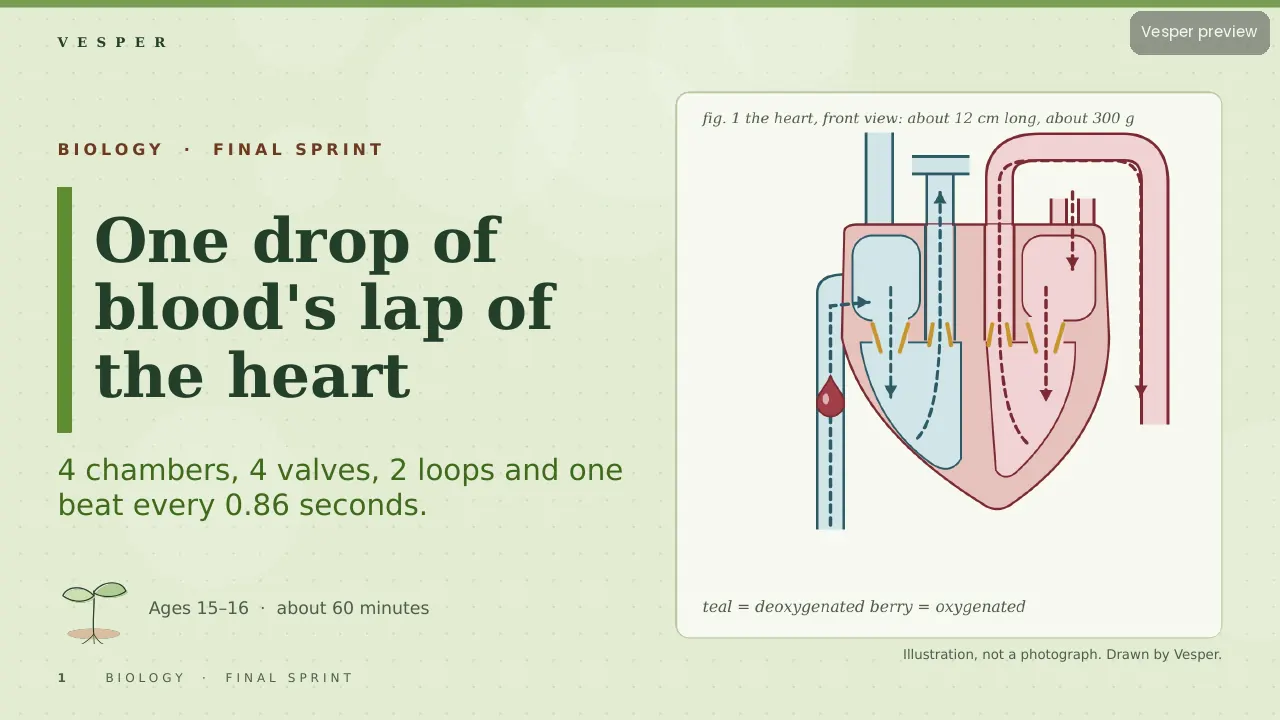
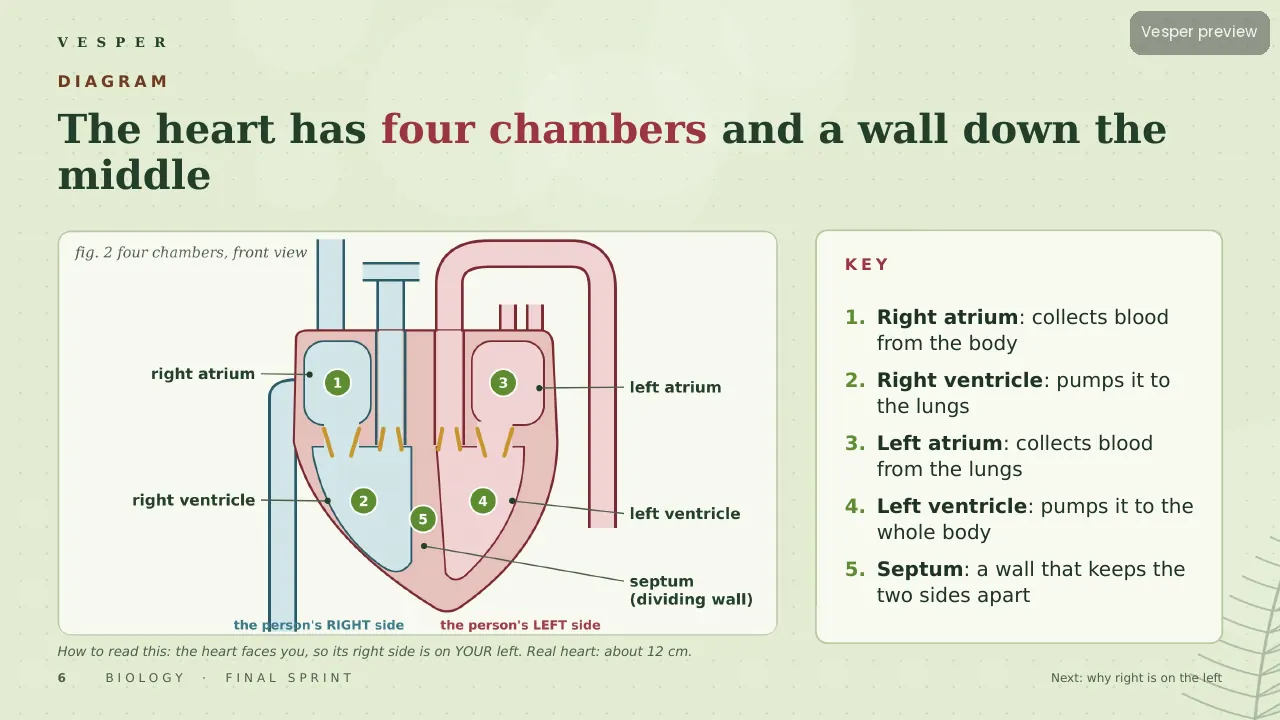
Put one red blood cell into a vein in your big toe and follow it. Students trace it through the vena cava, right atrium, tricuspid valve and right ventricle, out to the lungs, back to the left side and up the aorta. Every step sits on one labelled heart diagram with one colour code: teal for deoxygenated blood, berry for oxygenated.
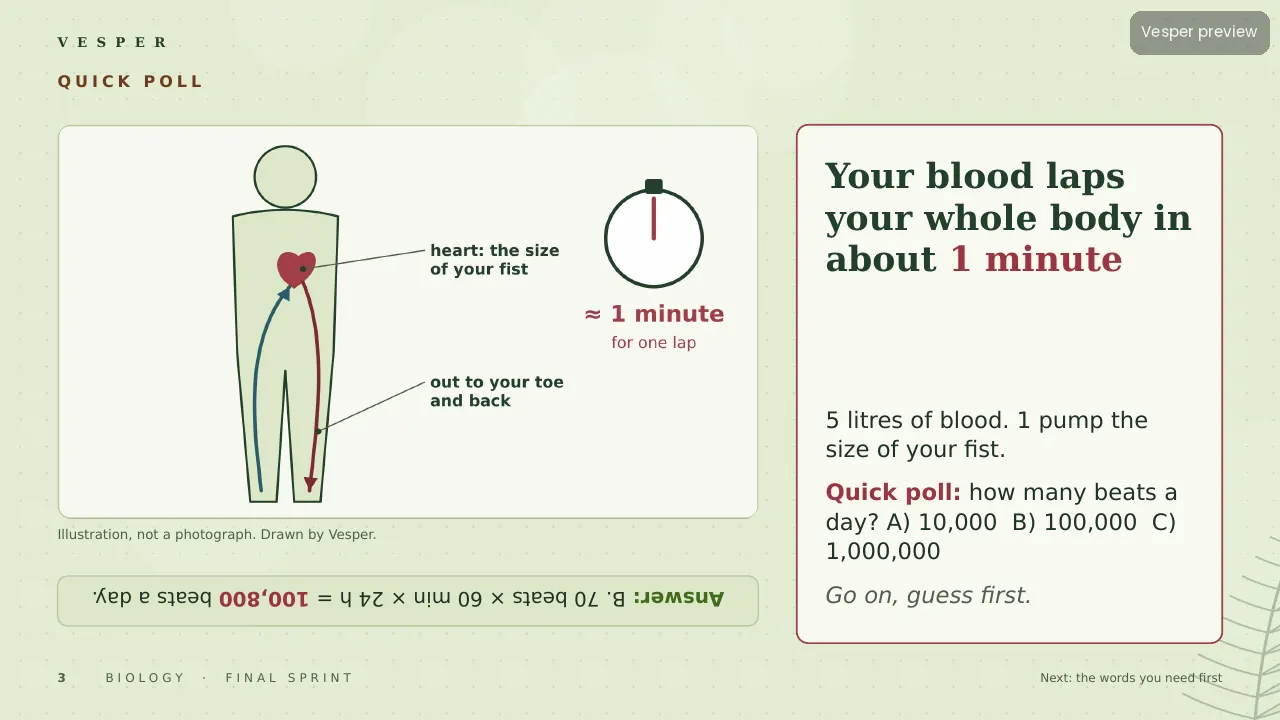
Real numbers make it stick. One drop holds about 250 million red cells. At 70 beats a minute a beat lasts 0.86 s, and 70 bpm × 70 ml gives a cardiac output of 4,900 ml a minute. Students explain why the left ventricle wall is about three times thicker (about 120 mmHg against 25 mmHg), why the pulmonary artery breaks the ‘arteries carry oxygen’ rule, and what a 120/80 reading means. Sam’s back-to-front labelling and the blue-blood myth both get fixed on the way.
Inside the deck
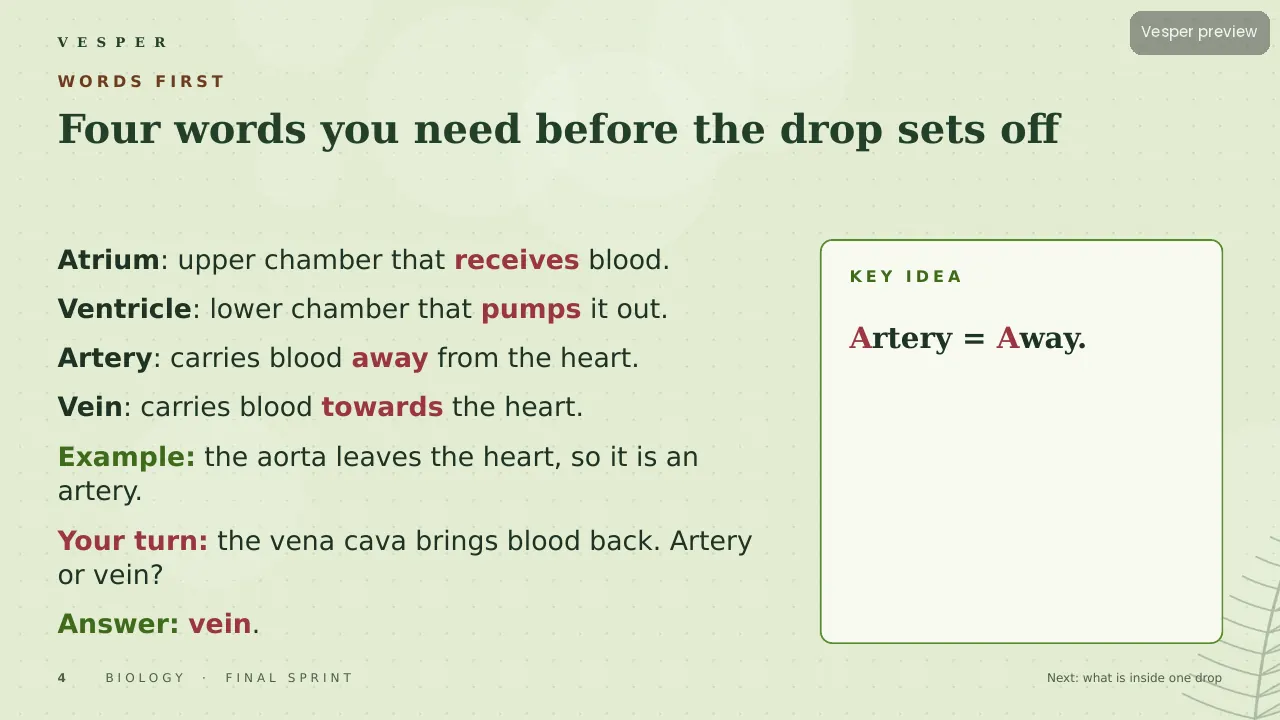
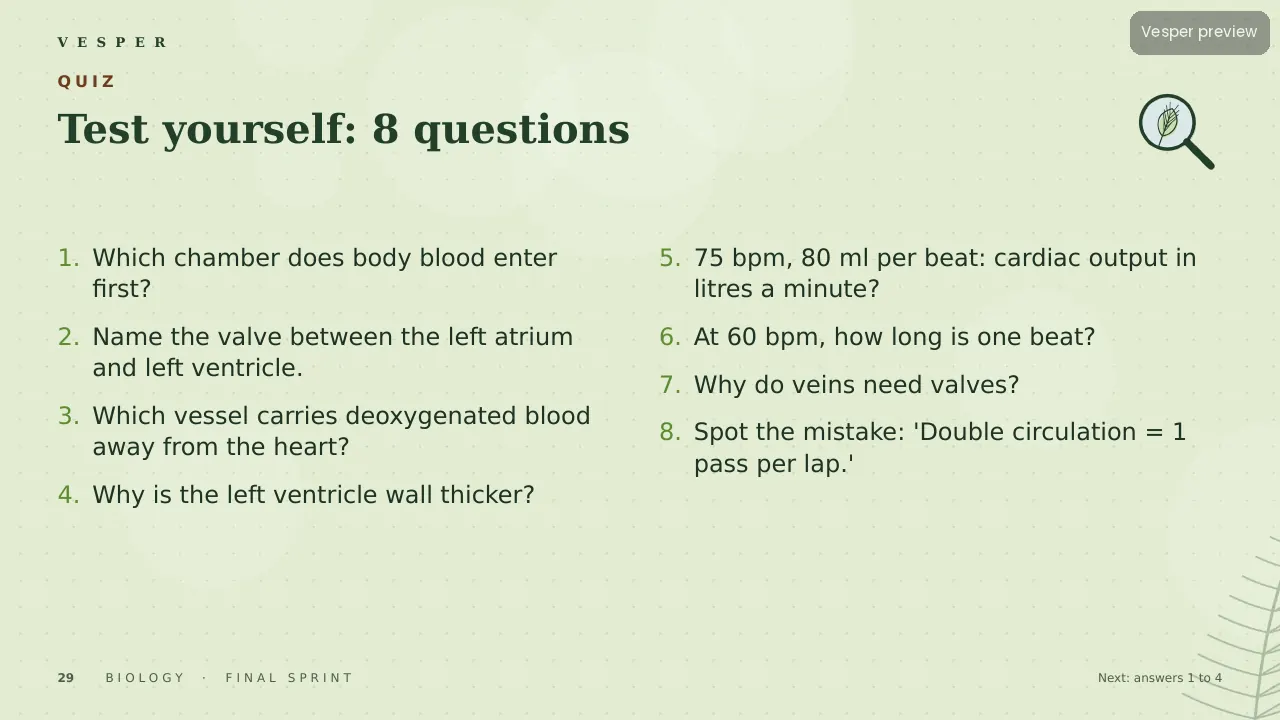
35 slides on the Field Notes template: a quick-poll hook, a four-word primer, three diagrams, two diagram walks, worked examples with your-turn questions, two checkpoints and a frontier slide on whether heart muscle can repair itself (about 1% renewal a year at 25). An eight-question quiz has explained answers, and a 6-mark exam question comes with a mark scheme that shows where each mark goes.
How to teach it
One lesson of about 60 minutes. The pulse activity (count for 15 seconds, multiply by 4) turns students’ own heart rates into the cardiac-output sum. Speaker notes on every slide flag the common slips, such as left and right on a diagram.
Who it’s for
Learners aged 15–16 revising transport in animals, and teachers who want the route to stick before the exam. Part of the Final Sprint collection.